
1) INTRODUCTION:
François Doyon La Rochelle:
You’re listening to Capital Topics, episode #57!
This is a monthly podcast about passive asset management and financial and tax planning ideas for the long-term investor.
Your hosts for this podcast are James Parkyn and me François Doyon La Rochelle, both portfolio managers with PWL Capital.
In this episode, we will discuss the following points:
For our first topic, we will review the powerful advantages of building your portfolio with total market ETF’s.
And for our next topic, we will discuss Canada’s Tax System and try to answer the following question: do high earners pay their fair share of taxes?
Enjoy!
2) THE POWERFULL ADVANTAGES OF TOTAL MARKET ETF’S:
François Doyon La Rochelle: In our first subject for today, we will address why we prefer using total market ETFs or mutual funds to build our portfolios rather than other investment solutions, that replicate recognized commercial benchmarks such as the S&P500 Index for U.S. equity, the S&P/TSX 60 Index here in Canada and other large-cap benchmarks.
James Parkyn: Yes, we often highlight in our podcasts and our blogs that we build portfolios using broad-based ETFs and mutual funds. I believe François, we have never really delved into the details as to why we do this. So, what motivated us to tackle this topic is that we recently discussed it with a new client about his portfolio implementation. He asked us why we were using a U.S. total market ETF for our U.S. equity exposure rather than using the highly touted S&P500 index.
François Doyon La Rochelle: Exactly, we thought it was a good opportunity to prepare an update on our research on the Topic. So, we reached out to our colleague Raymond Kerzérho, PWL’s Senior Researcher, and asked him to look into this. In late August, he published his findings in a paper entitled “US Total Market or S&P 500 ETFs?”. This paper is available on the PWL website, and we will share the link with our listeners with this podcast.
James Parkyn: I would note for our listeners that this paper focuses on the US equity Market, specifically the Vanguard US total market index ETF Vs. the S&P500 index ETF. So, François, what does the paper say?
François Doyon La Rochelle: As you mentioned James, Raymond, as the title of his article suggests, looked at the question from a U.S. equity perspective only. He looked at the mechanics and the historical performance of the total market approach using the CRSP US Total Market Index against the S&P500 Index.
James Parkyn: Our listeners may not be familiar with CRSP, this is an acronym that stands for Center for Research in Security Prices which is an affiliate of the University of the Chicago Booth School of Business. The CRSP Market Indexes are widely known and used by leading financial academics because of their research-quality data. It’s safe to say, however, that the CRSP market indexes are virtually unknown in the retail investing world.
François Doyon La Rochelle: Indeed, CRSP indexes are not well-known to most investors. On the other hand, the S&P500 Index or the Dow Jones Industrial Average are quoted daily in the financial media therefore they resonate more with investors. However, what’s interesting here is that the world’s largest fund, the Vanguard U.S. Total Market Index, is a fund we buy for our clients’ portfolios, and uses the CRSP US Total Market as a benchmark.
James Parkyn: That’s interesting Francois but how does the CRSP US Total Market compare with a more commercial index like the S&P500?
François Doyon La Rochelle: Well, the big difference here is the number of stocks held in each one, the CRSP US Total Market holds over 3,800 U.S. stocks which represents roughly 99.5% of the market capitalization of U.S. stocks. It holds not only large-cap securities but also mid and small-cap stocks. By comparison, the S&P500 Index holds roughly 500 U.S. large-cap stocks representing about 80% of the US market capitalization. Although it’s the most popular benchmark for U.S. stocks it does not hold mid and small-caps stocks.
James Parkyn: So, the advantage of using the CRSP US Total Market Index compared to the S&P500 index is that you are adding another 3,300 stocks to your portfolio. This increases your diversification benefit as you gain exposure to the total US stock market by close to 20 percentage points to 99.5% of the total U.S. stock market.
François Doyon La Rochelle: Correct, you are effectively holding all U.S. stocks, you are adding a lot of companies to your portfolio, so broader diversification and more importantly, as I said earlier, you are adding mid and small-cap stocks.
James Parkyn: What else does Raymond say in his paper?
François Doyon La Rochelle: He covered the stock inclusion methodology for both indexes. He explained that the methodology for the CRSP index was rules-based and that stocks were added based on their weighted free float-adjusted capitalization with little human intervention.
James Parkyn: For our listeners, the free-float methodology is a method of calculating the market capitalization of a stock by multiplying its price by the number of shares readily available in the market and then ranking the stocks from the largest to smallest.
François Doyon La Rochelle: Correct and in comparison, he mentions that the stocks in the S&P500 Index are also weighed on a free float-adjusted capitalization but that eligibility for inclusion follows a two-step process. The first step is based on specific objective criteria that Raymond enumerates in his paper. In the second step, once the list of eligible stocks is established, an index committee selects the 500 securities. The problem with this and I quote Raymond “this committee-based step makes the S&P500 Index similar to an actively managed index”.
James Parkyn: That’s interesting, but what does the historical performance say?
François Doyon La Rochelle: Since the launch of the S&P500 Index in March 1957 up to June 2023, the CRSP US Total Market Index has slightly outperformed the S&P500 Index by a small margin of 0.03%. The CRSP Index returned 10.48% while the S&P500 returned 10.45% on an annualized basis. This outperformance came with slightly higher volatility. Mid and small-cap stocks, which are included in the CRSP US Total Market index, exhibit higher volatility than the S&P500 Index which generally only includes large-cap stocks.
James Parkyn: Despite this small difference in performance, what’s important to understand here is that adding small-cap stocks to your portfolio increases its expected return. Several academic research papers have produced evidence that historically, small-cap stocks have delivered higher returns than large-cap stocks.
François Doyon La Rochelle: That’s correct James, based on research from Fama & French. The small cap or size premium is even more compelling if you exclude from the portfolio small growth low profitability stocks which have historically failed to deliver the size premium. This idea of excluding small growth profitability stocks is one of the many advantages of using Dimensional funds in our client’s portfolio. In all their equity funds they exclude these stocks.
James Parkyn: What kind of size premium are we talking about here if you exclude these small growth low profitability stocks?
François Doyon La Rochelle: Well based on Dimensional’s small-cap indexes, in the last 30 years ending August 31, 2023, the small-cap premium in Canada was 0.66%, so a bit less than 1%. This is not the holy grail but if you look at other markets, in the U.S. for example, it was 1.42%. In internationally developed countries it was 1.86% and in emerging markets, it was a sizeable 2.3%. In the U.S., when we look at longer periods, for example, data going back 90 years, the small cap premium was 2.23%.
James Parkyn: Wow, these premiums are huge, however, investors need to understand that small-cap stocks will not outperform large-cap stocks every month or even every year. But there is no free lunch unless you stay invested for long periods to capture the expected size premium.
François, what do you think of adding an S&P400 Index ETF for the mid-cap stocks and an S&P600 Index for the small-cap stocks to an S&P500 Index ETF to build a portfolio? Does that make any sense?
François Doyon La Rochelle: Unless an investor plans to deviate from the U.S. total market portfolio, I would not go that route because that portfolio would require more trading to rebalance and keep the marketlike allocation between the three size baskets. It would increase costs and it would likely be less tax efficient because of capital gains being triggered during the reconstitution of the indexes when stocks move from the small-cap index to the mid-cap index or from the mid-cap index to the large-cap index.
James Parkyn: For our listeners, the reconstitution of an index is by definition the process that involves sorting, adding, and removing stocks to ensure that an index reflects an up-to-date market capitalization and style. But for Canadian taxable residents, you are at risk that during these reconstitution events, that you will be attributed capital gains that will be taxed as ordinary income as 100% of your marginal tax rate. We learned from this the hard way about 20 years ago.
François Doyon La Rochelle: I would also add, that by holding the entire market with one ETF you don’t have to worry about what is called the reconstitution effect. This is when active traders or hedge funds, trade ahead of the reconstitution date of the index to try to make a profit from the upcoming changes. They buy the additions and sell the deletions before the indexers therefore they push the prices up for the indexers on the additions and push the prices down on the deletions.
James Parkyn: Yes, and once the indexers have adjusted their portfolios the prices of these additions and deletions generally reverse, and that’s when additions normally underperform, and deletions outperform.
François Doyon La Rochelle: To conclude James, I believe that holding a total market ETF or mutual fund is the perfect holding for simplicity, broad diversification, and tax efficiency. Furthermore, as Raymond has highlighted in his conclusion based on research from the University of Arizona, and I quote “At the margin, a small number of winning stocks explains the long-term market performance”. Therefore, to benefit, I prefer holding all the stocks to make sure I have all the winners in my portfolio. By including small-caps and mid-caps stocks you are increasing the odds of holding the next large-cap or mega cap stock winners. I will finish by quoting Raymond’s paper again and I quote “the risk of missing out on the high return stocks was highlighted in 2020 when the S&P500 Index committee failed to include Tesla’s shares in the index until December after the share’s price had increased by 400%.”
3) CANADA’S TAX SYSTEM: DO HIGH EARNERS PAY THEIR FAIR SHARE OF TAXES? :
Francois Doyon La Rochelle: James our Main Topic today is a real hot-button issue for all Canadians. Everyone feels they pay too much tax. There is a general perception that the very wealthy can find ways to pay less than their fair share. Raising taxes on top-income earners is often proposed as a solution for generating a lot of extra revenues and at the same time reducing inequality in Canada. So, what do you have to share with us today, James?
James Parkyn: Well, Francois, there is a misconception that top-income earners are not paying their fair share of taxes. Our clients are among the very wealthy and many qualify for the top 1% percent in terms of income. What we see is they pay a lot of taxes when measured based on Total Average Income tax rates and in dollar amounts paid to all levels of government.
Canada’s social safety net is a great achievement for successive generations in this country. It provides health care, support for the poor and disabled, and pensions for senior citizens among other critically important benefits that citizens of other countries can’t count on.
François Doyon La Rochelle: Of course, someone has to pay for all those services and they’re a big part of the reason why Canadians—especially higher-income earners—pay a lot of taxes.
James Parkyn: Now, most people support the idea that underpins our progressive tax system – those who earn more should pay more.
François Doyon La Rochelle: James, to me we don’t know the facts about who pays how much in taxes in Canada. What did you find?
James Parkyn: Well, Francois, I sourced recent studies that report that top-income earners collectively pay a disproportionate, and growing, share of both personal income taxes and total government taxes. These studies also found that raising taxes on top earners comes with considerable economic costs. Today I will focus on the findings of a Research Bulletin from the nonpartisan Fraser Institute called Measuring Progressivity in Canada’s Tax System, 2023.
François Doyon La Rochelle: So James, what does the Fraser Institute have to say?
James Parkyn: The Fraser Institute Report answers the question about who pays what in Canada in terms of both personal Income taxes and, interestingly in Terms of Total taxes that Canadians pay to federal, provincial, and municipal governments.
Their primary findings are:
that high-income families already pay a disproportionately large share of all Canadian income taxes. Indeed, the evidence shows that the top 20 percent of income-earning families pay nearly two-thirds (61.9 percent) of the country’s income taxes and more than half (53.1 percent) of total taxes.
In contrast, the bottom 20 percent of income-earning families are estimated to pay only 0.7 percent of all federal and provincial personal income taxes and 2.0 percent of total taxes in Canada.
François Doyon La Rochelle: This makes total sense as it demonstrates that Canada’s tax system is based on progressivity where the share of taxes paid typically increases as income rises. What else did you find in this Report?
James Parkyn: The Fraser Institute Report goes on to state that “Raising taxes on high-income earners ignores the economic consequences of tax rate increases and the associated behavioral responses of taxpayers when faced with higher tax rates or new taxes. For instance, in response to a tax increase, many taxpayers will change their behavior in ways that reduce their taxable income through tax planning, avoidance, or evasion that results in governments raising less revenue than anticipated.”
François Doyon La Rochelle: This reminds me of what American economist Arthur Laffer tried to prove with his work on the relationship between tax rates and the resulting levels of government tax revenue. The famous “Laffer curve” that influenced Reaganomics in the early 1980’s.
James Parkyn: Arthur Laffer and other economists have never been able to prove his theory. But, it is intuitive that somewhere along the curve of higher tax rates is a rate that maximizes government tax revenue, and beyond that rate, government revenues will fall. Finding that maximum rate has been a tricky exercise for governments.
François Doyon La Rochelle: Tax accountant Kim Moody writing in the Financial Post recently said it well: “In my experience, personal behaviors significantly change when personal tax rates approach 50 per cent. People will search for ways to lower their tax bills, especially when the perception is that there is not much value being provided when compared to the cost.”
James, we should share with our Listeners a little recent history of tax rates in Canada.
James Parkyn: So in 2015, the top marginal tax rates were around 48% in Canada. This was important because psychologically it was under the 50% threshold. These rates applied to ordinary income from employment, interest, and foreign investment income. Canadian source dividends were taxed a bit less. Capital gains are taxed at 50% of the gross gain.
The Capital Gains inclusion rate was set at 75% in 1990. A decade later, it dropped back down again to 66.67% on Feb. 28, 2000, and then further reduced on Oct. 18, 2000, to 50%, where it has remained until today.
François Doyon La Rochelle: What are the top marginal tax rates in effect in Canada now?
James Parkyn: In 2016, the federal government added a new top federal income tax bracket, raising the top federal tax rate from 29 to 33 percent on income over roughly $200,000. This single measure pushed us over the 50% combined top marginal rate. Add to that many provinces also increased their top rates.
For 2023, the top marginal income tax rate in Quebec is 53.31% and in Ontario, it’s 53.53% and both kick in at $235,675 of taxable income. In B.C. it’s 53.50% starting at $240,716. We are now well above the 50% psychological threshold.
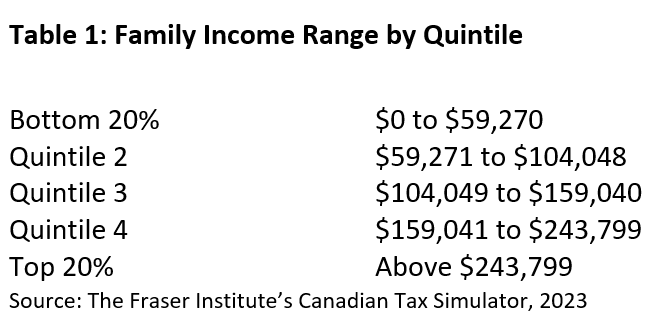
François Doyon La Rochelle: James, how does the Fraser Institute Research Bulletin break out the data for taxes paid by all Canadians?
James Parkyn: This bulletin reviews the current proportion of taxes that each income group pays. In other words, it compares total income earned to total taxes paid. Canadian families are divided into five groups (quintiles) based on their total income, with each group containing 20 percent of all families in the country. The first quintile consists of the bottom 20 percent of income earners and the fifth quintile comprises the top 20 percent. Although personal income taxes (PIT) are paid by individuals, the study examines data based on families because individual income is not the best indicator of each person’s well-being.
François Doyon La Rochelle: James, what does the Fraser Institute Research Bulletin say about average tax rates for Personal Income tax paid by all Canadians?
James Parkyn:

Average tax rates represent the total amount of personal income taxes paid by the quintile divided by their total income. What this research shows, is that average tax rates increase as family income rises, reflecting Canada’s progressive PIT system
In terms of the total personal income taxes paid, the top 20% of income earners pay just under two-thirds of all personal income taxes (61.9 percent), while receiving less than half of the country’s family income (45.7 percent). In other words, top-income earners pay about 16 percentage points more than their share of total income.
François Doyon La Rochelle: James, what does the Fraser Institute Research Bulletin say about average total tax rates paid by all Canadians when we include all types of taxes?
James Parkyn:

Average tax rates for total taxes paid by income group, covering all Canadian taxes, tell the same story. The Frazer Institute research calculates the total amount of taxes paid by quintile, divided by their total income. Similar to personal income taxes, the research shows that average tax rates rise as family incomes increase. The bottom 20 percent of income-earning families pay an average tax rate of 18.5 percent while the top 20 percent pays 54.2 percent (over half their income to taxes).
François Doyon La Rochelle: James, what are the Fiscal challenges going forward for the Federal government with the Aging Population?
James Parkyn: The big challenge is the sustainability of OAS (Old Age Security). Many experts feel it is under threat as our population ages. Francois, OAS cost $69 billion in 2022. By 2027 it is projected to cost $96 billion. This $27-billion increase is as large as the entire budget for Employment Insurance or the Canada Child Benefit. There’s no escape from the fact that OAS costs are rising faster than all other policy measures in the federal budget. Unfortunately, tax revenues are not keeping pace with the rising cost of OAS. This will likely result in growing government deficits unless we change the rules.
François Doyon La Rochelle: Professor Paul Kershaw of UBC wrote an article recently in the Globe and Mail where he stated that “…the Federal government is forecasting $132 billion in deficits projected over the next five years. Fully 84 percent of those deficits can be accounted for by increases in OAS spending, along with more money for medical care used by those over the age of 64.” This is going to put added pressure on the Federal government to generate more revenues or cut benefits.
James Parkyn: Well Francois, in this year’s Federal Budget, new rules concerning alternative minimum tax (AMT) were introduced. AMT is very technical so most Canadians are not aware of how this will impact them.
François Doyon La Rochelle: What are the changes James?
James Parkyn: In the 2023 federal budget, the government proposed increasing the AMT rate to 20.5%, up from 15% under the existing AMT regime. The AMT exemption level would increase to an estimated $173,000 (indexed annually) from a fixed $40,000. The changes are meant to take effect next year on Jan. 1, 2024. Ottawa hopes the changes will ensure the highest earners cannot combine certain incentives in the Income Tax Act, including the donation tax credit, to drive their tax rate below a minimum rate. The AMT proposals “are expected to affect very few taxpayers” due in part to the significant increase to the basic exemption amount.
François Doyon La Rochelle: I have read that many Tax practitioners say the federal government’s proposed new alternative minimum tax (AMT) regime may discourage philanthropy by punishing people who make large charitable donations.
James Parkyn: Yes, I have heard that from many tax professionals we work with. Among proposed changes, only half of the donation tax credit can be applied against the AMT, down from 100% under the current rules. Meanwhile, 30% of capital gains on the donation of publicly listed securities will now be included in adjusted taxable income (ATI). These highly technical rules are going to materially impact Canadians who are making very large charitable donations of stocks with large capital gains. Many charitable organisations are making representation to the Federal government on how this will negatively impact them. We will discuss these changes in more details in our next podcast when we’ll address Year-End tax planning.
François Doyon La Rochelle: AMT Rules are indeed very technical and beyond the scope of most taxpayers.
James Parkyn: I will now wrap this topic up Francois. the Fraser Institute Research Bulletin demonstrates that top income earners in Canada actually pay a disproportionate share of income taxes relative to other income groups, primarily due to the progressive nature of the country’s tax system. Indeed, the current share of taxes paid by high-income earners greatly exceeds their collective share of income.
François Doyon La Rochelle: As I said at the outset, this is a hot topic for many Canadian high income earners and we certainly hope that our government will be very thoughtful in how they plan changes to future tax policies.
1) CONCLUSION:
François Doyon La Rochelle: Thank you, James Parkyn for sharing your expertise and your knowledge.
James Parkyn: You are welcome, Francois.
François Doyon La Rochelle: That’s it for episode #57 of Capital Topics!
Do not forget, if you would like to submit questions or suggestions for the show, please email us at: capitaltopics@pwlcapital.com
Also, if you like our podcast, please share it when with family and friends and if you have not subscribed to it, please do.
Again, thank you for tuning in and please join us for our next episode on November 23rd.
See you soon!